pp.43-44
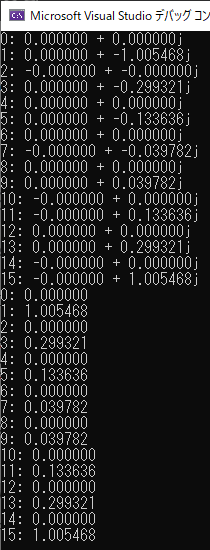
テキストのサンプルコードに正規化の項を加えて函数化した。
#define _USE_MATH_DEFINES
#include <iostream>
#include <cmath>
void dft(const double* samples, double* spectrums_real, double* spectrums_imag, double* spectrums_abs, const int N) {
const double NORM_FACTOR = (2.0 / N);
double _2PI = 2.0 * M_PI;
double theta;
for (int k = 0; k < N; k++) {
for (int n = 0; n < N; n++) {
theta = _2PI * k * n / N;
spectrums_real[k] += cos(theta) * samples[n] * NORM_FACTOR;
spectrums_imag[k] += -sin(theta) * samples[n] * NORM_FACTOR;
}
spectrums_abs[k] = sqrt(pow(spectrums_real[k], 2.0) + pow(spectrums_imag[k], 2.0));
}
}
int main() {
const double samples[] = { 0,0.8,0.8,0.8,0.8,0.8,0.8,0.8,0,-0.8,-0.8,-0.8,-0.8,-0.8,-0.8,-0.8 };
const int N = sizeof(samples) / sizeof(samples[0]);
double spectrums_real[N] = {};
double spectrums_imag[N] = {};
double spectrums_abs[N] = {};
dft(samples, spectrums_real, spectrums_imag, spectrums_abs, N);
for (int k = 0; k < N; k++) {
printf("%d: %f + %f\n", k, spectrums_real[k], spectrums_imag[k]);
}
for (int k = 0; k < N; k++) {
printf("%d: %f\n", k, spectrums_abs[k]);
}
return 0;
}

ループは使わない。
import numpy as np
import matplotlib.pyplot as plt
def dft(samples):
N = np.size(samples)
NORM_FACTOR = (2.0 / N)
k = np.arange(N)
n = np.reshape(k, [N, 1])
theta = 2.0 * np.pi * k * n / N
spectrums_real = np.sum( np.cos(theta) * samples, axis=1) * NORM_FACTOR
spectrums_imag = np.sum(-np.sin(theta) * samples, axis=1) * NORM_FACTOR
spectrums_abs = np.sqrt(np.power(spectrums_real, 2) + np.power(spectrums_imag, 2))
return spectrums_real, spectrums_imag, spectrums_abs
if __name__ == "__main__":
samples = np.array([0,0.8,0.8,0.8,0.8,0.8,0.8,0.8,0,-0.8,-0.8,-0.8,-0.8,-0.8,-0.8,-0.8])
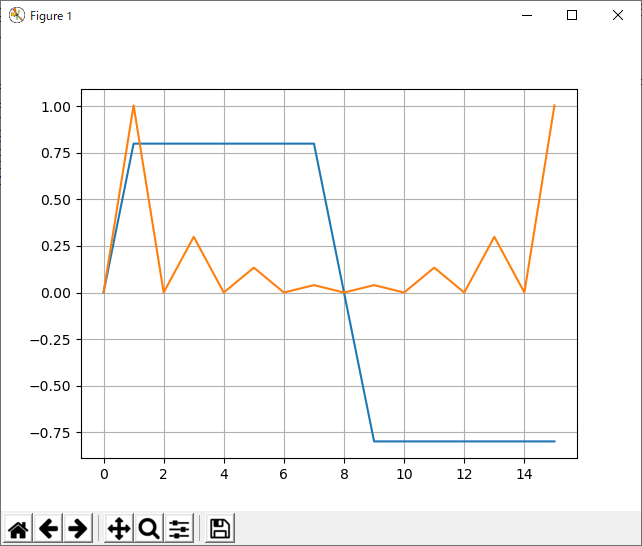
plt.plot(samples)
_, _, spectrums_abs = dft(samples)
print(spectrums_abs)
plt.plot(spectrums_abs)
plt.grid()
plt.show()

インデックスは1から始まる。ループは使わない。
samples= {0,0.8,0.8,0.8,0.8,0.8,0.8,0.8,0,-0.8,-0.8,-0.8,-0.8,-0.8,-0.8,-0.8};
num=Length[samples];
kn=Table[ k*n, {k,0,num-1}, {n,0,num-1}];
normFactor = 2.0/num;
theta = 2.0 * Pi * kn / num;
spectrumsReal = Total[ Cos[theta] * samples] * normFactor
spectrumsImag = Total[-Sin[theta] * samples] * normFactor
spectrumsAbs = Sqrt[spectrumsReal^2 + spectrumsImag^2]

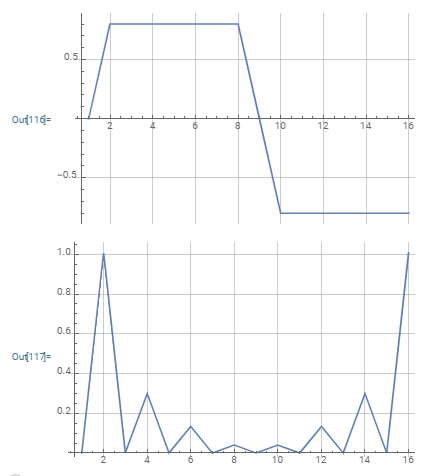
ListLinePlot[samples, PlotRange -> All,GridLines -> Automatic ]
ListLinePlot[spectrumsAbs, PlotRange -> All,GridLines -> Automatic ]
